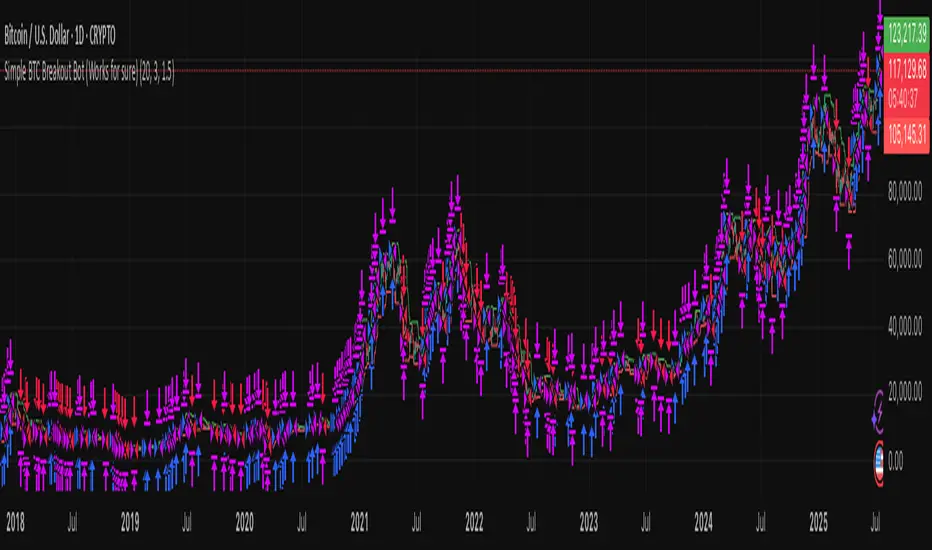
Simple BTC Breakout Bot (Works for sure)🚀 Simple BTC Breakout Bot (Works for sure)
This strategy is designed for BTC/USDT breakout trading using recent highs and lows. It automatically detects breakout signals and manages trades with Take Profit and Stop Loss to help manage risk and lock in profits.
Key Features:
🔍 Breakout Detection:
Enters a long position when price crosses above the highest high of the last N candles (default 20).
Enters a short position when price crosses below the lowest low of the last N candles.
💰 Risk Management:
Automatically sets a Take Profit (default 3%) and Stop Loss (default 1.5%) for every trade.
📊 Visuals:
Plots breakout levels (highest high in green, lowest low in red) on the chart.
🔔 Alerts:
Sends alerts on every breakout trade for long and short entries, compatible with TradingView’s alert system.
Parameters:
⏳ Breakout Lookback Period: Number of candles to check for breakouts (default: 20)
🎯 Take Profit (%): Profit target as a percentage from entry price (default: 3%)
🚫 Stop Loss (%): Maximum loss allowed as a percentage from entry price (default: 1.5%)
⚠️ Disclaimer:
This strategy is based on historical data and does not guarantee future profits. Always backtest and trade with proper risk management.
Penunjuk dan strategi
MA Crossover Strategy with TP/SL📊 MA Crossover Strategy with TP/SL
This strategy uses two simple moving averages (SMAs) to catch trend changes and trade breakouts with clear risk management.
🔥 How it works:
Enters a Long position when the fast SMA (short period) crosses above the slow SMA (long period), signaling an upward trend.
Enters a Short position when the fast SMA crosses below the slow SMA, signaling a downward trend.
🎯 Features:
Take Profit (TP): Automatically closes the trade at a defined percentage profit.
Stop Loss (SL): Limits potential losses with a predefined stop level.
Customizable parameters: Adjust the lengths of the moving averages, TP%, and SL% to fit your style.
Alerts: Receive notifications on every trade entry for timely action.
⚡️ Designed for traders looking for a simple, effective trend-following system with built-in risk control.

1H & 2H Candle Panel + Daily Grid v1.2Indicator: "1H & 2H Candle Panel + Daily Grid v1.2"
This powerful indicator combines two key features into one tool:
Daily Grid anchored to the previous day’s close
Multi-Timeframe Candle Panel for comprehensive market analysis
1. Daily Grid Logic
Input:
Grid Distance (Points): Adjustable spacing between grid lines (default: 5.0 pts).
How It Works:
Detects the start of a new trading day using ta.change(time("D")).
Fetches the prior day’s close via request.security().
Draws the following elements at each new session:
Thick Red Line: Previous day’s closing price (key reference level).
8-Point Grid:
4 blue lines above the close (+1x to +4x the grid distance).
4 gold lines below the close (-1x to -4x the grid distance).
Info Label: Displays the exact prior close value.
Automatically clears and redraws all elements daily to avoid clutter.
2. Multi-Timeframe Candle Panel
Timeframes Analyzed:
Current chart TF, 30M, 1H, 2H, 3H, 4H, 6H, 12H, and Daily (1D).
Data Displayed per TF:
Open, Close, High, Low
Price Difference (Close − Open)
Candle Type (Bullish/Bearish)
Time remaining until candle close (hh:mm:ss format)
Visual Output:
A right-aligned table with conditional coloring:
Bullish candles: Green background
Bearish candles: Red background
Current timeframe highlighted in purple.
Optimized Updates:
Uses request.security() for efficient cross-TF data fetching.
Tracks candle closing times via TradingView’s native time_close.
Updates only on the last bar or in real-time (barstate.islast/isrealtime).
3. Confluence Signals
Full Confluence:
Triggers when all timeframes align:
Buy Signal: All candles bullish → Green arrow + alert.
Sell Signal: All candles bearish → Red arrow + alert.
1H Special Confluence:
Activates 30 minutes after the 1H candle opens.
Requires alignment between 1H, 4H, and 6H candles.
Marks entries with price-level arrows (no alerts).
4. Technical Optimizations
Performance:
Dynamically manages graphic objects (no redundant redrawing).
Uses arrays to track grid lines efficiently.
Precision:
Leverages TradingView’s time_close for accurate countdowns.
Formats prices with format.mintick for asset-specific precision.
How to Use
Adjust Grid Distance based on asset volatility.
Monitor the panel for multi-TF trend strength.
Use the daily grid as support/resistance reference.
Confluence signals highlight high-probability setups.
Pro Tip: Combine with volume analysis or RSI for confirmation!


Z-Score Volume with CVD Clustering Script Title:
Z-Score Volume with CVD Clustering & NY VWAP
📘 Description:
This indicator combines statistical volume analysis with order flow confirmation to detect high-probability trade zones and volume-based divergences.
📌 Components:
Z-Score of Volume: Identifies statistically significant volume surges or drops relative to a moving average baseline.
Cumulative Volume Delta (CVD): Gauges net buying vs. selling pressure using high-frequency bid/ask delta.
K-Means Clustering: Applies clustering logic to classify each bar into:
Cluster 2 – Strong Bullish: Z-Score and CVD both strong
Cluster 1 – Divergence / Bull Trap: Z-Score high, but weak CVD
Cluster 0 – Neutral / Noise: No clear alignment
Anchored VWAP (NY Session Open): Confirms market structure and institutional trend bias from 9:30 AM ET forward.
🎯 Suggested Applications:
✅ 1. Trend Continuation Entries (Add-ons):
Look to add to positions when:
Cluster 2 signal occurs
Price is above the NY session VWAP
Price structure has broken out of prior day high/low or range
⚠️ 2. Divergence Detection (Fade Traps):
Cluster 1 signals a bearish divergence (e.g., high volume but weak CVD).
Especially useful when price is failing to stay above VWAP.
Useful for early exits or reversal setups.
📊 3. Volume Profile Confirmation:
Combine with fixed or session-based volume profile tools.
Use Z-Score clusters to confirm volume spikes into low-volume nodes (LVNs) or during imbalance transitions.
📍 4. VWAP Structure Confirmation:
Anchored VWAP acts as a dynamic reference point.
Helps confirm acceptance vs. rejection zones at key institutional levels.
📈 Visuals & Alerts:
Color-coded volume bars show intensity of Z-Score & CVD confluence
CVD Line plots real-time delta bias with green/red coloring
Cluster-based shape markers highlight key bars for actionable signals
Optional: Add alerts for Cluster 2 above VWAP or Cluster 1 below VWAP
⚙️ Customization Options:
Adjustable Z-Score length
Custom anchor timeframe for CVD (e.g., 1D or sessions)
Adjustable max lookback depth
Toggle VWAP inclusion
Extendable to include additional filters: RSI, structure break alerts, etc.
🔧 Ideal Use Cases:
NY session intraday traders (ES, NQ, CL, 6E, FX pairs)
Breakout traders wanting order flow confirmation
Mean reversion traders spotting fake moves
Volume-based scalpers looking for edge on short-term order imbalance

MTF Confirmation v2Multi-Timeframe Direction Confirmation Indicator
📊 Overview
This Pine Script indicator provides high-probability buy and sell signals by confirming that both 1-minute and 5-minute timeframes are moving in the same direction. It eliminates false signals by requiring multiple timeframe agreement before generating alerts.
🎯 How It Works
Trend Detection Method:
EMA Analysis: Uses 20-period Exponential Moving Average to determine trend direction
RSI Confirmation: 14-period RSI validates momentum (>50 bullish, <50 bearish)
Price Action: Confirms price is above/below EMA in trend direction
EMA Slope: Ensures EMA is actually rising (bullish) or falling (bearish)
Signal Generation:
BUY Signal: Only when BOTH 1M and 5M timeframes are bullish simultaneously
SELL Signal: Only when BOTH 1M and 5M timeframes are bearish simultaneously
Cooldown System: Prevents signal spam with 5-bar minimum between signals
📈 Visual Elements
Primary Signals:
Green "BUY" Labels: Appear below candles when both timeframes align bullish
Red "SELL" Labels: Appear above candles when both timeframes align bearish
Background Colors:
Light Green: Both timeframes trending up
Light Red: Both timeframes trending down
No Color: Timeframes not aligned or neutral
Trend Indicators:
Blue Dots: Show 1-minute timeframe trend direction
Orange Dots: Show 5-minute timeframe trend direction
Question Marks: Partial alignment (one timeframe trending, preparing for signal)
Status Table (Top Right):
Timeframe Status: Real-time direction of each timeframe
Alignment Status: Shows when timeframes are synchronized
Signal Status: Current signal state and cooldown timers
Cooldown Counters: Bars remaining until next signal available
⚙️ Customizable Settings
Technical Parameters:
EMA Period: Default 20 (trend smoothness)
RSI Period: Default 14 (momentum sensitivity)
Signal Cooldown: Default 5 bars (prevents overtrading)
Filter Options:
Volume Filter: Optional above-average volume requirement
Alerts Toggle: Enable/disable notifications
Table Display: Show/hide status information
🚨 Alert System
Instant Notifications: Alerts fire when both timeframes align
Price Information: Includes current price in alert message
Once Per Bar: Prevents alert spam during volatile periods
Clear Messages: "BUY SIGNAL: 1M and 5M both BULLISH" format
💡 Best Use Cases
Ideal For:
Scalping: Quick entries with multi-timeframe confirmation
Day Trading: Reliable intraday signals
Trend Following: Catching strong directional moves
Risk Management: Avoiding false breakouts
Timeframe Recommendations:
Works on any chart timeframe
Most effective on 1M, 5M, or 15M charts
Provides earlier signals than single-timeframe indicators
⚡ Key Advantages
Reduced False Signals:
Requires agreement between multiple timeframes
Filters out noise and whipsaws
Cooldown prevents overtrading
Clear Decision Making:
Simple buy/sell signals
Visual confirmation through colors and table
No complex interpretation required
Comprehensive Information:
Real-time status of all timeframes
Setup warnings with question marks
Countdown to next available signal
📋 Setup Instructions
Copy the Pine Script code
Open TradingView Pine Editor
Paste code and save
Add to chart
Configure settings to preference
Set up alerts for desired signals
🎪 Expected Performance
Signal Frequency: 3-8 signals per trading day (depending on volatility)
Quality Focus: Fewer but higher-probability setups
Win Rate: Improved due to multi-timeframe confirmation
Suitable for: Both automated and manual trading strategies

Light MA CrossExplanation of the "Light MA Cross" Indicator
Overview:
The "Light MA Cross" is a simple yet powerful trading indicator designed to identify potential buy and sell signals based on the crossover of two moving averages. This tool is optimized for short-term trading, specifically on 1-minute charts, making it ideal for active traders looking to capture quick market moves.

NEPALI DASHBOARD NEPALI DASHBORAD - All-In-One Sentiment Dashboard
Overview
The NEPALI DASHBORAD is a comprehensive, all-in-one dashboard designed to give day traders a quick yet powerful overview of market sentiment. Instead of cluttering your chart with dozens of individual indicators, this tool consolidates the signals from 11 different technical indicators into a single, easy-to-read table. It calculates an overall bull/bear sentiment score and provides a trading recommendation based on the confluence of these signals, helping you make more informed decisions at a glance.
The dashboard is fully customizable, allowing you to adjust indicator settings, change the table size, and move it to any corner of your chart.
Key Features
Multi-Indicator Analysis: Gathers data from 11 essential indicators covering trend, momentum, volume, and volatility.
Sentiment Score: Calculates a simple "Bull vs. Bear" score to instantly gauge market sentiment.
Actionable Recommendations: Provides a clear trading recommendation (Strong Buy, Buy, Sell, Strong Sell, Hold) based on the strength of the confluence.
Higher Timeframe (HTF) Context: Includes an HTF trend analysis to ensure your trades align with the bigger picture.
Customizable Dashboard: Easily change the size and position of the dashboard to fit your workspace.
How to Use
Check the Market Sentiment: Look at the "Bull vs. Bear" score first. A high score (e.g., 8 vs. 3) indicates strong confluence in one direction.
Verify the HTF Trend: Ensure your intended trade direction aligns with the higher timeframe trend for better probability. For example, be cautious about taking "SELL" signals if the HTF Trend is strongly "BULL."
Use the Recommendation as a Guide: The "Recommendation" and "Confidence" % give you a summary of the indicator signals. A "STRONG BUY" or "STRONG SELL" means that a significant majority of the indicators are in agreement.
Drill Down into Indicators: Use the individual indicator statuses in the table to understand why the market sentiment is bullish or bearish. For example, you might see that momentum indicators (RSI, Stoch) are bullish, but trend indicators (MA, MACD) are still lagging.
Combine with Your Strategy: This dashboard is a powerful confirmation tool. Use its signals to confirm entries and exits for your existing trading strategy. Do not use it as a standalone signal provider.
Disclaimer
In simple terms: This is a tool for analysis, not a signal to trade. Your money is your responsibility.
This script is for educational and informational purposes only. I am not a financial advisor; I am just a learner sharing my work. The information and tools provided are not, and should not be construed as, financial advice, an offer, or a solicitation to buy or sell any securities.
Trading and investing in financial markets involve substantial risk of loss and is not suitable for every investor. I do not guarantee the accuracy, completeness, or profitability of this script. All trading decisions you make are your own, and you are solely responsible for any resulting profits or losses.
Always conduct your own research and seek advice from a qualified financial advisor before making any investment decisions. By using this script, you agree that I am not liable for any and all losses you may incur.

VWAP with Prev. Session BandsVWAP with Prev. Session Bands is an advanced indicator based on TradingView’s original VWAP. It adds configurable standard deviation or percentage-based bands, both for the current and previous session. You can anchor the VWAP to various timeframes or events (like Sessions, Weeks, Months, Earnings, etc.) and selectively show up to three bands.
The unique feature of this script is the ability to display the VWAP and bands from the previous session, helping traders visualize mean reversion levels or historical volatility ranges.
Built on top of the official TradingView VWAP implementation, this version provides enhanced flexibility and visual clarity for intraday and swing traders alike.

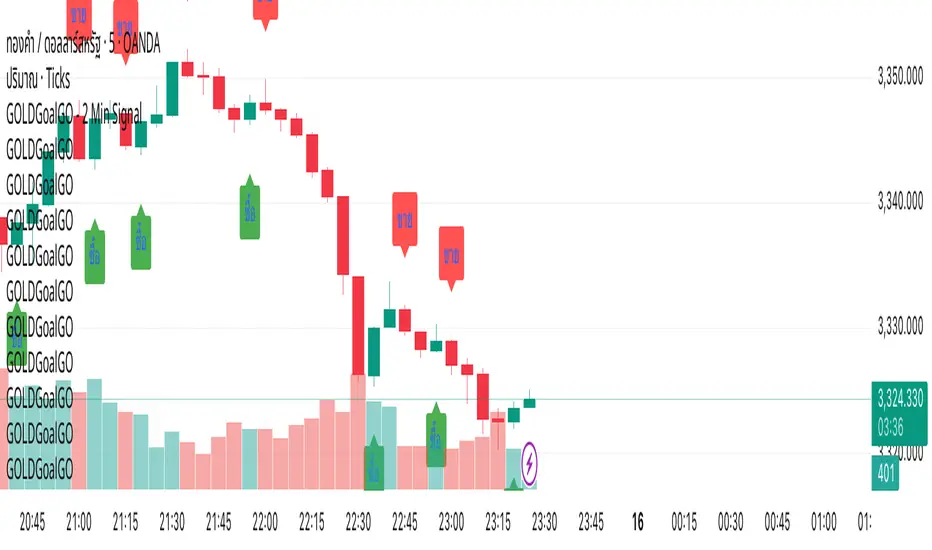
GOLDGoalGO - 2 Min SignalGOLDGoalGO" Indicator for TradingView
Introduction
The "GOLDGoalGO" indicator is designed to assist traders in analyzing short-term price movements of gold (XAUUSD). It provides buy and sell signals every 5 minutes, helping traders identify optimal entry and exit points based on recent price changes.
Concept and Functionality
Primary Goal: To offer clear and timely trading signals by analyzing short-term price trends, specifically tailored for 2-minute intervals.
How It Works: The indicator calculates the change in closing prices compared to the previous bar to generate buy and sell signals. These signals are only active during 2-minute timeframes, ensuring precision in short-term trading.
Signals Provided:
A buy signal (represented by an upward shape) appears when prices show upward momentum.
A sell signal (represented by a downward shape) appears when prices show downward momentum.
Visual Cues: The signals are displayed directly on the chart with intuitive shapes for quick recognition. Additionally, alert notifications are configured to inform you immediately when new signals occur.
How the Indicator Works in Detail
Timeframe Check: It activates only during 2-minute candlestick intervals to ensure signals are relevant for short-term trading.
Price Change Calculation: It compares the current close with the previous close to detect the direction of market movement.
Signal Generation:
If the price is increasing (positive change), a buy signal is generated.
If the price is decreasing (negative change), a sell signal is generated.
Chart Annotations: When a signal occurs, a shape appears on the chart indicating the optimal point for entering a trade.
Automated Alerts: The system sends a Thai-language notification every 2 minutes to alert you of new signals, enabling timely actions even when you're away from the screen.
How to Use
Paste this script into the Pine Editor in TradingView.
Click "Add to Chart" to activate the indicator.
Set up Alert rules:
Choose the alert condition for "Buy Signal" or "Sell Signal".
Select webhook or notification options to receive real-time alerts (for example, to Telegram).
The indicator provides real-time notifications every 2 minutes whenever new signals are generated.
Why Use This Indicator?
Simplicity: Designed for traders who prefer short-term, momentum-based trading strategies.
Timely Alerts: Signals are provided precisely every 2 minutes, helping you capitalize on short-term price movements.
Flexibility: Easily adaptable to other assets by adjusting the script if needed.
OneMonthFVGLibrary "OneMonthFVG"
The library is searching the open 1M FVG
find_one_m_fvg(provided_bull_fvgs)
Parameters:
provided_bull_fvgs (array)
BullFVG
Fields:
right (series int)
top (series float)
left (series int)
bottom (series float)

GOLDGoalGO"GOLDGoalGO" Indicator for TradingView
Introduction
The "GOLDGoalGO" indicator is designed to assist traders in analyzing short-term price movements of gold (XAUUSD). It provides buy and sell signals every 5 minutes, helping traders identify optimal entry and exit points based on recent price changes.
Concept and Functionality
Primary Goal: To offer clear and timely trading signals by analyzing short-term price trends, specifically tailored for 5-minute intervals.
How It Works: The indicator calculates the change in closing prices compared to the previous bar to generate buy and sell signals. These signals are only active during 5-minute timeframes, ensuring precision in short-term trading.
Signals Provided:
A buy signal (represented by an upward shape) appears when prices show upward momentum.
A sell signal (represented by a downward shape) appears when prices show downward momentum.
Visual Cues: The signals are displayed directly on the chart with intuitive shapes for quick recognition. Additionally, alert notifications are configured to inform you immediately when new signals occur.
How the Indicator Works in Detail
Timeframe Check: It activates only during 5-minute candlestick intervals to ensure signals are relevant for short-term trading.
Price Change Calculation: It compares the current close with the previous close to detect the direction of market movement.
Signal Generation:
If the price is increasing (positive change), a buy signal is generated.
If the price is decreasing (negative change), a sell signal is generated.
Chart Annotations: When a signal occurs, a shape appears on the chart indicating the optimal point for entering a trade.
Automated Alerts: The system sends a Thai-language notification every 5 minutes to alert you of new signals, enabling timely actions even when you're away from the screen.
How to Use
Paste this script into the Pine Editor in TradingView.
Click "Add to Chart" to activate the indicator.
Set up Alert rules:
Choose the alert condition for "Buy Signal" or "Sell Signal".
Select webhook or notification options to receive real-time alerts (for example, to Telegram).
The indicator provides real-time notifications every 5 minutes whenever new signals are generated.
Why Use This Indicator?
Simplicity: Designed for traders who prefer short-term, momentum-based trading strategies.
Timely Alerts: Signals are provided precisely every 5 minutes, helping you capitalize on short-term price movements.
Flexibility: Easily adaptable to other assets by adjusting the script if needed.
Summary
The "GOLDGoalGO" indicator helps traders stay on top of short-term market trends for gold, giving precise buy and sell signals every 5 minutes. With visual cues on the chart and notifications sent automatically in Thai, it ensures you're always informed of potential trading opportunities and can act swiftly to maximize profit.
Dashboard EMA Unifié [touli]DISCLAIMER
This indicator is provided for educational and informational purposes only. It does not constitute investment advice, a recommendation to buy or sell, or a solicitation for any transaction. Past performance is not indicative of future results. Trading involves significant risk, including the potential loss of capital. The user assumes full responsibility for their own trading decisions and risk management. The author of this script cannot be held liable for any losses or damages resulting from its use.
Indicator Title: Unified EMA Dashboard
Overview
This indicator is a comprehensive technical analysis tool that combines the display of Exponential Moving Averages (EMAs) on the chart with a multi-timeframe dashboard. It is designed to provide traders with a quick and clear overview of the trend across multiple timeframes, while also providing visual cues directly on the current chart.
Key Features
Multi-Timeframe Dashboard: Displays a clean and concise table showing the price's position relative to four different EMAs (9, 21, 50, 200) across 6 timeframes (from 1 minute to 1 day).
A blue arrow ▲ indicates that the closing price is above the EMA (potential bullish trend).
A red arrow ▼ indicates that the closing price is below the EMA (potential bearish trend).
Display of 4 EMAs on the Chart:
EMA 9 & 21: Plotted on the current timeframe, they help identify the very short-term trend.
EMA 50 (from the 5m TF) & EMA 200 (from the 15m TF): Plotted on the current chart but calculated on higher timeframes. They offer a perspective on the stronger, underlying trends.
Full Customization: The indicator's settings allow the user to:
Modify the periods of the four EMAs.
Choose the dashboard's position on the screen.
Change the dashboard's theme (Dark or Light).
Enable or disable the display of the EMAs on the chart.
Optimized Code: The script is designed for performance, drawing and calculating the dashboard only on the last available price bar, thus avoiding chart lag.
How to Use
1. Installation
On TradingView, open the chart of your chosen asset.
At the bottom of the screen, click on the "Pine Editor" tab.
Copy the entire corrected script and paste it into the editor, replacing any existing content.
Click the "Add to Chart" button. The indicator will then appear on your chart.
2. Configuration
Click the gear icon (⚙️) next to the indicator's name to access its settings.
General Settings:
Dashboard Theme: Choose "Dark" or "Light" for better readability depending on your chart's color scheme.
Dashboard Position: Select where you want the dashboard to appear (e.g., "Bottom Right," "Top Left," etc.).
EMA Settings:
Modify the periods (9, 21, 50, 200) if you prefer to use other values for your analysis.
Chart Display Settings:
Check or uncheck the boxes to show or hide the EMA lines on your main chart. For instance, you can disable the lines and only use the dashboard.
3. Interpretation (For Informational Purposes)
The Dashboard:
Confluence Analysis: The dashboard's main strength is identifying trend "confluence." A column that is entirely blue (▲) or red (▼) suggests a strong, aligned trend across multiple time scales.
Identifying Reversal Points: If the shorter timeframes (1m, 5m) start to change color while the longer ones (4h, 1D) remain stable, this may indicate a pullback or the beginning of a trend change.
The EMAs on the Chart:
Dynamic Support and Resistance: The EMA lines can act as areas of support in an uptrend and resistance in a downtrend.
Underlying Trend: The price's position relative to the longer-period EMAs (50 and 200) gives an indication of the general underlying trend.
Best Practices and Limitations
Do Not Use in Isolation: This indicator is a trend confirmation tool. It is recommended to use it in conjunction with other analysis tools (volume, market structure, other indicators).
Lagging Indicator: Moving averages are trend-following indicators, which means they react to past price movements. They do not predict future movements.
Risk Management: Always set a stop-loss and take-profit for every trade. Never risk more than a small percentage of your capital on a single position.

Fractal Pullback Market StructureFractal Pullback Market Structure
Author: The_Forex_Steward
License: Mozilla Public License 2.0
The Fractal Pullback Market Structure indicator is a sophisticated price action tool designed to visualize internal structure shifts and break-of-structure (BoS) events with high accuracy. It leverages fractal pullback logic to identify market swing points and confirm whether a directional change has occurred.
This indicator detects swing highs and lows based on fractal behavior, drawing zigzag lines to connect these key pivot points. It classifies and labels each structural point as either a Higher High (HH), Higher Low (HL), Lower High (LH), or Lower Low (LL). Internal shifts are marked using triangle symbols on the chart, distinguishing bullish from bearish developments.
Break of Structure events are confirmed when price closes beyond the most recent swing high or low, and a horizontal line is drawn at the breakout level. This helps traders validate when a structural trend change is underway.
Users can configure the lookback period that defines the sensitivity of the pullback detection, as well as a timeframe multiplier to align the logic with higher timeframes such as 4H or Daily. There are visual customization settings for the zigzag lines and BoS markers, including color, width, and style (solid, dotted, or dashed).
Alerts are available for each key structural label—HH, HL, LH, LL—as well as for BoS events. These alerts are filtered through a selectable alert mode that separates signals by timeframe category: Low Timeframe (LTF), Medium Timeframe (MTF), and High Timeframe (HTF). Each mode allows the user to receive alerts only when relevant to their strategy.
This indicator excels in trend confirmation and reversal detection. Traders can use it to identify developing structure, validate internal shifts, and anticipate breakout continuation or rejection. It is particularly useful for Smart Money Concept (SMC) traders, swing traders, and those looking to refine entries and exits based on price structure rather than lagging indicators.
Visual clarity, adaptable timeframe logic, and precise structural event detection make this tool a valuable addition to any price action trader’s toolkit.

Multi-Timeframe 200 SMAs (2m, 5m, 10m, 1H, 1D)Intraday 200 SMA Multi-Timeframe Overlay
This indicator displays the 200-period Simple Moving Averages (SMA) from the 2-minute, 5-minute, 10-minute, 1-hour, and 1-day timeframes on any chart — providing powerful multi-timeframe context for intraday trading.
Each moving average is color-coded and labeled for quick reference, helping traders identify dynamic support and resistance levels across key timeframes without needing to switch charts. Designed specifically for day traders, this tool enhances situational awareness and assists in aligning trades with broader trend direction.
Features:
2-minute 200 SMA (Yellow)
5-minute 200 SMA (Light Orange)
10-minute 200 SMA (Dark Orange)
1-hour 200 SMA (Red)
1-day 200 SMA (Purple)
Displayed on any intraday chart
Clean line styles with optional labels for timeframe reference
Perfect for scalpers and intraday swing traders who rely on higher timeframe moving averages for confluence and trade validation.


RAA Buy Sell[RanaAlgo]Overview
The RAA (RanaAlgo Adaptive Average) Buy Sell indicator is a trend-following tool that helps identify potential buy and sell signals based on price deviation from an adaptive moving average. It uses a combination of:
(Fractal Adaptive Moving Average) – Adjusts its sensitivity based on market volatility.
RAA Bands – Dynamic upper/lower bands calculated using a multiplier applied to the average deviation.
🔹 Key Features
Trend Identification
Bullish Trend →
Bearish Trend →
Signal Generation
Visual Enhancements
Colored candles (green for bullish, red for bearish).
Dynamic bands to visualize trend strength.
Alerts
Customizable buy/sell alerts for real-time notifications.
🔹 Usefulness in Trading
✅ Trend Confirmation – Helps confirm trend direction before entering trades.
✅ Reduces False Signals – Uses adaptive bands to filter out noise.
✅ Works Across Timeframes – Effective on intraday, swing, and long-term trading.
✅ Customizable – Adjustable length and multiplier for different market conditions.
🔹 Best Used For
Trend-following strategies (riding strong trends).
Breakout trading (entering when price confirms momentum).
Avoiding choppy markets (since the adaptive bands widen in volatility).

MAGGIFX - Timings🧲 Maggifx Sessions Indicator
The Maggifx Indicator is designed for intraday traders seeking precision and visual clarity when navigating the market’s main sessions. Built upon the Market Magnetism Theorem, it automatically highlights key time zones — Asia, London, and New York — to help identify imbalances, manipulations, and high-probability entries.
✅ Key Features:
📦 Custom session boxes for Asia, London, and New York.
🔀 Adjustable time zone setting (default: UTC-3).
🧭 Highlights the Asian range midpoint — essential for forecasting directional shifts.
📈 Auto-extension of Asian highs and lows to assess breakouts or liquidity grabs.
🧊 Strategic micro-blocks (5:30, 7:30, 12:00) to mark potential polarity shifts.
🎯 Visual marker for the daily starting point.
🎨 Fully customizable colors and styles, matching any chart layout.
🎓 Perfect for:
Traders of XAUUSD, NASDAQ, SP500, US30, EURUSD, and GBPUSD.
Strategies based on liquidity, inducements, and reaction to key zones.
Anyone using the Maggifx Methodology or working with Session Timing.
Let me know if you want a shorter, punchier version for Instagram or a tech-spec bullet sheet for advanced users.

EMA10/14 Crossover + Body Filter (Clean Version)📌 อินดิเคเตอร์นี้ใช้สำหรับจับสัญญาณเข้าออเดอร์ตามระบบ EMA10/EMA14 Crossover พร้อมตัวกรองจากลักษณะ “เนื้อเทียน” (Candle Body) ซึ่งช่วยลดสัญญาณหลอก (Fake Signal) ได้ดี เหมาะสำหรับผู้ที่ดูเทรนด์จาก TF ใหญ่ แล้วใช้ TF เล็กในการเข้าไม้
✅ คุณสมบัติ:
- สัญญาณ Buy เมื่อ EMA10 ตัด EMA14 ขึ้น + เนื้อเทียนอยู่เหนือเส้น
- สัญญาณ Sell เมื่อ EMA10 ตัด EMA14 ลง + เนื้อเทียนอยู่ใต้เส้น
- มีลูกศรแสดงสัญญาณบนกราฟชัดเจน
- ใช้ยืนยันจุดเข้าไม้ได้ดีในระบบเทรนด์หรือ SMC
⚠️ หมายเหตุ:
อินดิเคเตอร์นี้ไม่ได้ใช้เทรดเดี่ยวๆ แต่ควรใช้ร่วมกับการวิเคราะห์ TF ใหญ่ และโซน Demand/Supply ที่คุณวิเคราะห์เอง
— — — — — — — — — — — —
📌 This indicator is designed to capture trading signals based on EMA10/EMA14 crossover with a candle body filter to reduce fake signals. It is ideal for traders who follow higher timeframe trend analysis and use lower timeframes for precise entries.
✅ Features:
- Buy signal when EMA10 crosses above EMA14 and the candle body is above both lines
- Sell signal when EMA10 crosses below EMA14 and the candle body is below both lines
- Clear arrow markers on the chart for visual confirmation
- Excellent for confirming entries in trend-based or SMC-based strategies
⚠️ Note:
This tool is not meant to be used alone. For optimal performance, combine it with higher timeframe structure and manually identified supply/demand zones.

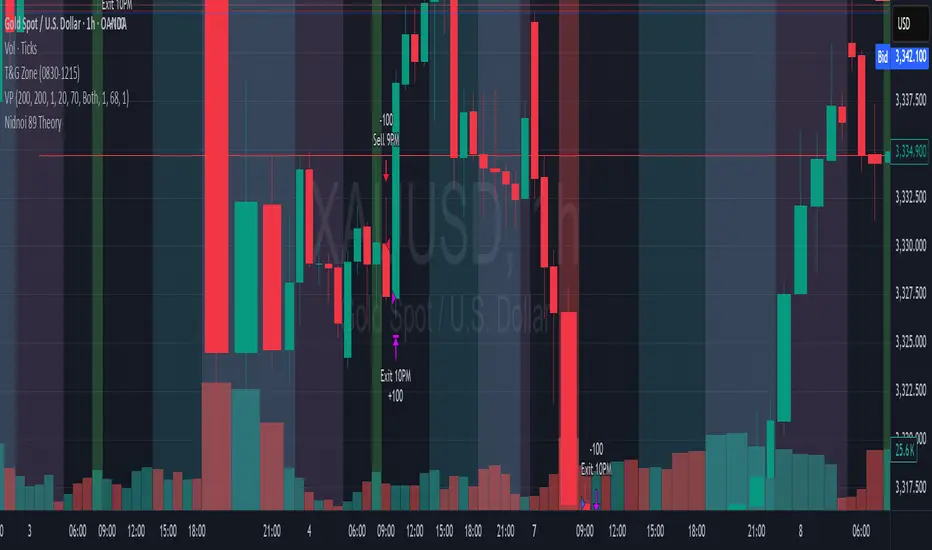
Nidnoi 89 TheoryNidnoi Morning Trading style
// This strategy is based on a reversal logic applied to the 8AM candle (Bangkok Time, UTC+7).
// The logic is:
// - If the 8AM candle is bullish (green), it indicates potential exhaustion — enter a SELL at the 9AM open.
// - If the 8AM candle is bearish (red), it suggests a possible bounce — enter a BUY at the 9AM open.
// All trades are closed at the 10AM open, limiting exposure to 1 hour.
//
// This strategy is designed for XAUUSD on a 1-hour chart and aligns with short-term intraday reversal patterns.
// The actual time used in code (UTC+7) is 9PM for the 8AM candle, and 10PM for the exit at 10AM.
//
// Highlights are shown on the 8AM candle for visual confirmation.
// Make sure your chart is set to 1H timeframe and uses XAUUSD.
Reversal IndicatorWhat does this indicator do?
This indicator is designed to help traders spot potential reversal points in the market by combining multiple conditions:
✅ Multi-Timeframe RSI – Checks RSI on a lower timeframe (like 5m) to see if the market is oversold or overbought.
✅ Higher Timeframe SMA Filter – Uses a higher timeframe SMA (like 1h) as a trend filter, so signals only trigger in the direction of the bigger trend.
✅ Candle Pattern Confirmation – Looks for bullish or bearish engulfing candles to confirm price exhaustion before signaling a reversal.
When all these conditions align, the indicator plots a triangle under/above the candle to highlight a possible reversal.
Why is this useful?
Many traders struggle with false RSI signals or candle patterns that fail because they don’t respect the larger trend.
This indicator filters out weak setups by requiring alignment between:
A lower timeframe RSI oversold/overbought condition,
A higher timeframe trend filter (SMA),
And a strong candle reversal pattern.
This multi-layer approach helps avoid chasing every RSI dip and focuses only on high-probability reversal zones.
How does it work?
Bullish reversal signal → appears when RSI on the lower TF is oversold, price is still above the higher TF SMA (trend still intact), AND a bullish engulfing candle forms.
Bearish reversal signal → appears when RSI on the lower TF is overbought, price is below the higher TF SMA, AND a bearish engulfing candle forms.
When all conditions match, the indicator plots a triangle under the candle for bullish signals and above the candle for bearish signals.
How to use it?
Choose your timeframes:
A timeframe for trend filtering (e.g. 1h).
A timeframe for RSI (e.g. 4h).
NOTICE: THE RSI TIMEFRAME SHOULD BE GREATER THEN THE TIMEFRAME FOR THE SMA
Otherwise it will not generate that much signals.
Watch for signals ONLY in the direction of the higher trend.
Use the signals as potential reversal points, not as guaranteed entries. Combine with your own confluence.
Optionally set alerts for bullish or bearish reversal conditions so you never miss a setup.
Customization
✅ Choose your RSI length & overbought/oversold levels.
✅ Select which timeframes you want for SMA & RSI.
✅ Toggle the higher TF SMA display on/off.
✅ Adjust signal appearance (triangles).
Important Notes
⚠️ This is not a standalone trading system. It’s a tool to help spot possible reversal areas. Always confirm with price action, support/resistance, or your own strategy

Orb [LUM3N]Orb – Opening Range Breakout Strategy with Confidence Engine
Description
The Orb script is a precision-engineered Opening Range Breakout (ORB) system designed for intraday and scalping strategies. Built around the first 15–30 minutes of price action, it identifies high-probability breakout entries, confirms momentum using 1-minute signals, and automatically calculates Fibonacci-based profit targets.
Key Features:
✅ Customizable ORB Timeframe (15 or 30 mins)
✅ Dynamic Stop Loss Options (Fixed %, ATR-based, EMA trailing)
✅ Fibonacci Take Profit Targets (1.272 / 1.618 / 2.0)
✅ Retest Logic with Smart Labels (confirms strength after breakout)
✅ Time-Based Exit Functionality (automatically closes trades after X minutes)
✅ Built-in Volume Spike Filter (optional)
✅ Multi-Factor Confidence Score using RSI, MACD Histogram, and VWAP
✅ Live Dashboard displaying entry price, TP levels, live % gain, and signal confidence
The confidence engine uses a weighted scoring system to determine if a breakout is High, Medium, or Low confidence — giving traders more control and clarity.
Ideal for structured day traders looking to automate key rules and reduce guesswork.
